Preschoolers in Oneida County, NY
27 Jul 2020
Tags: cartography , utica
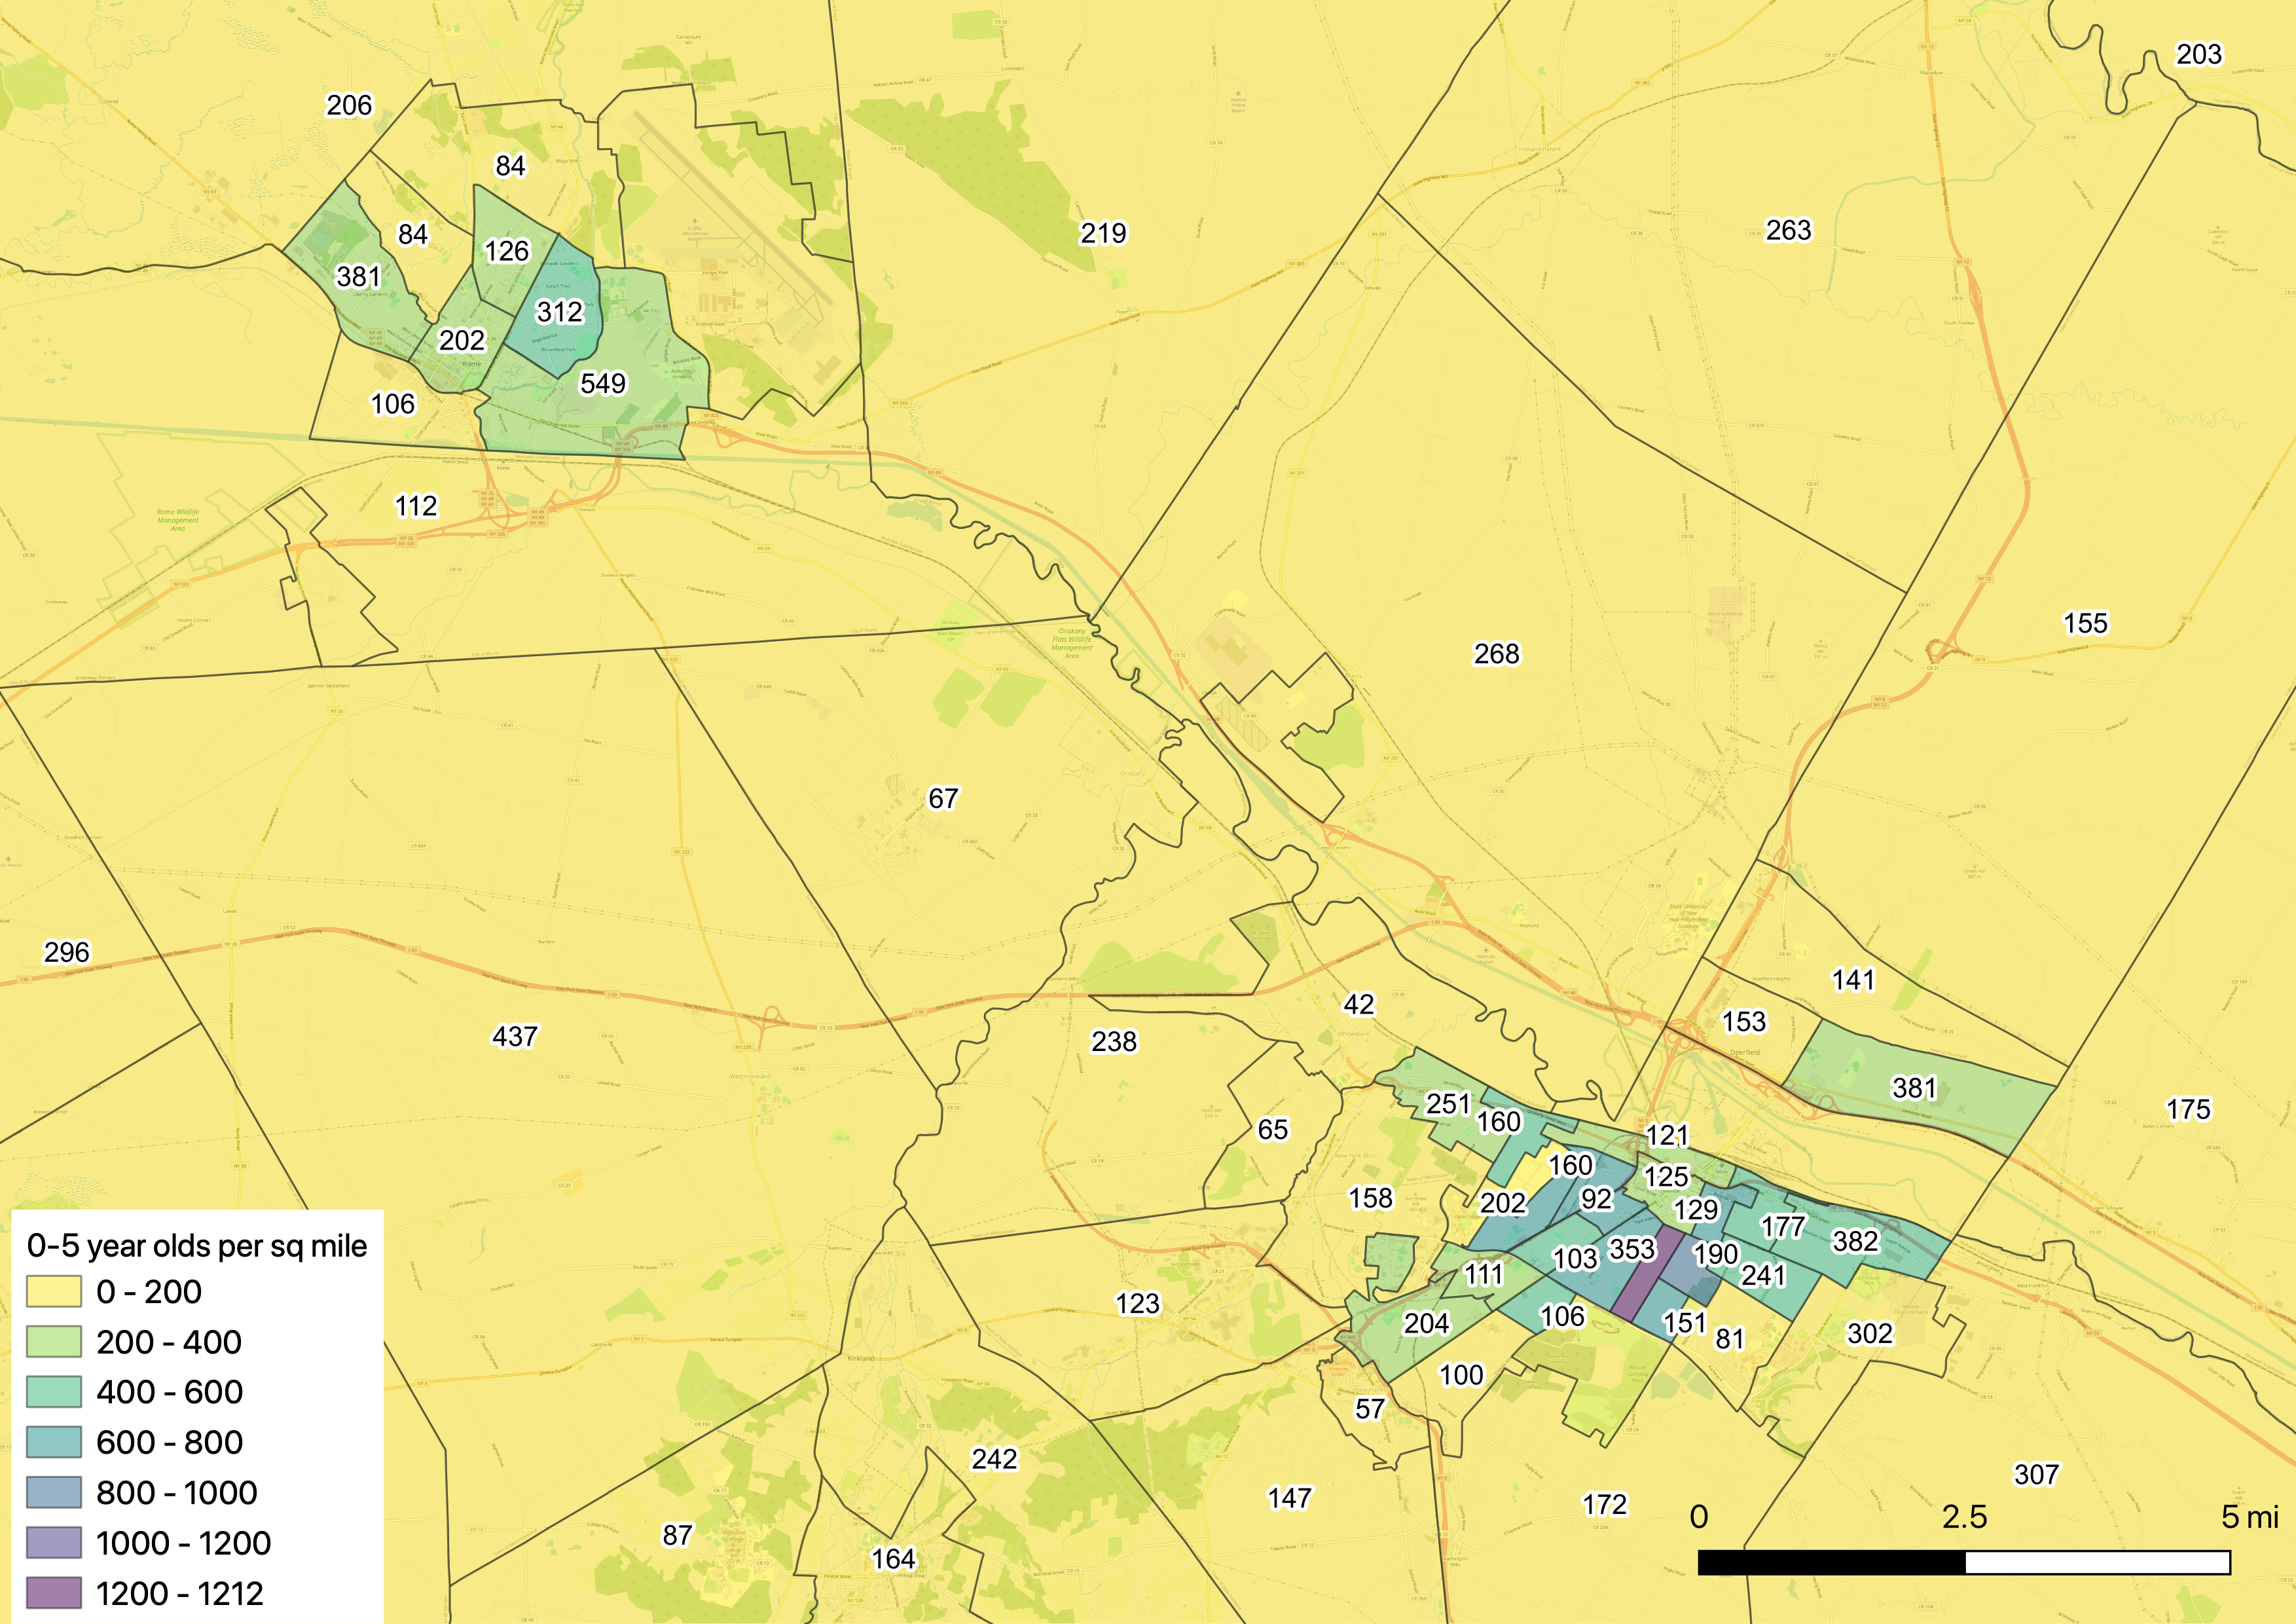
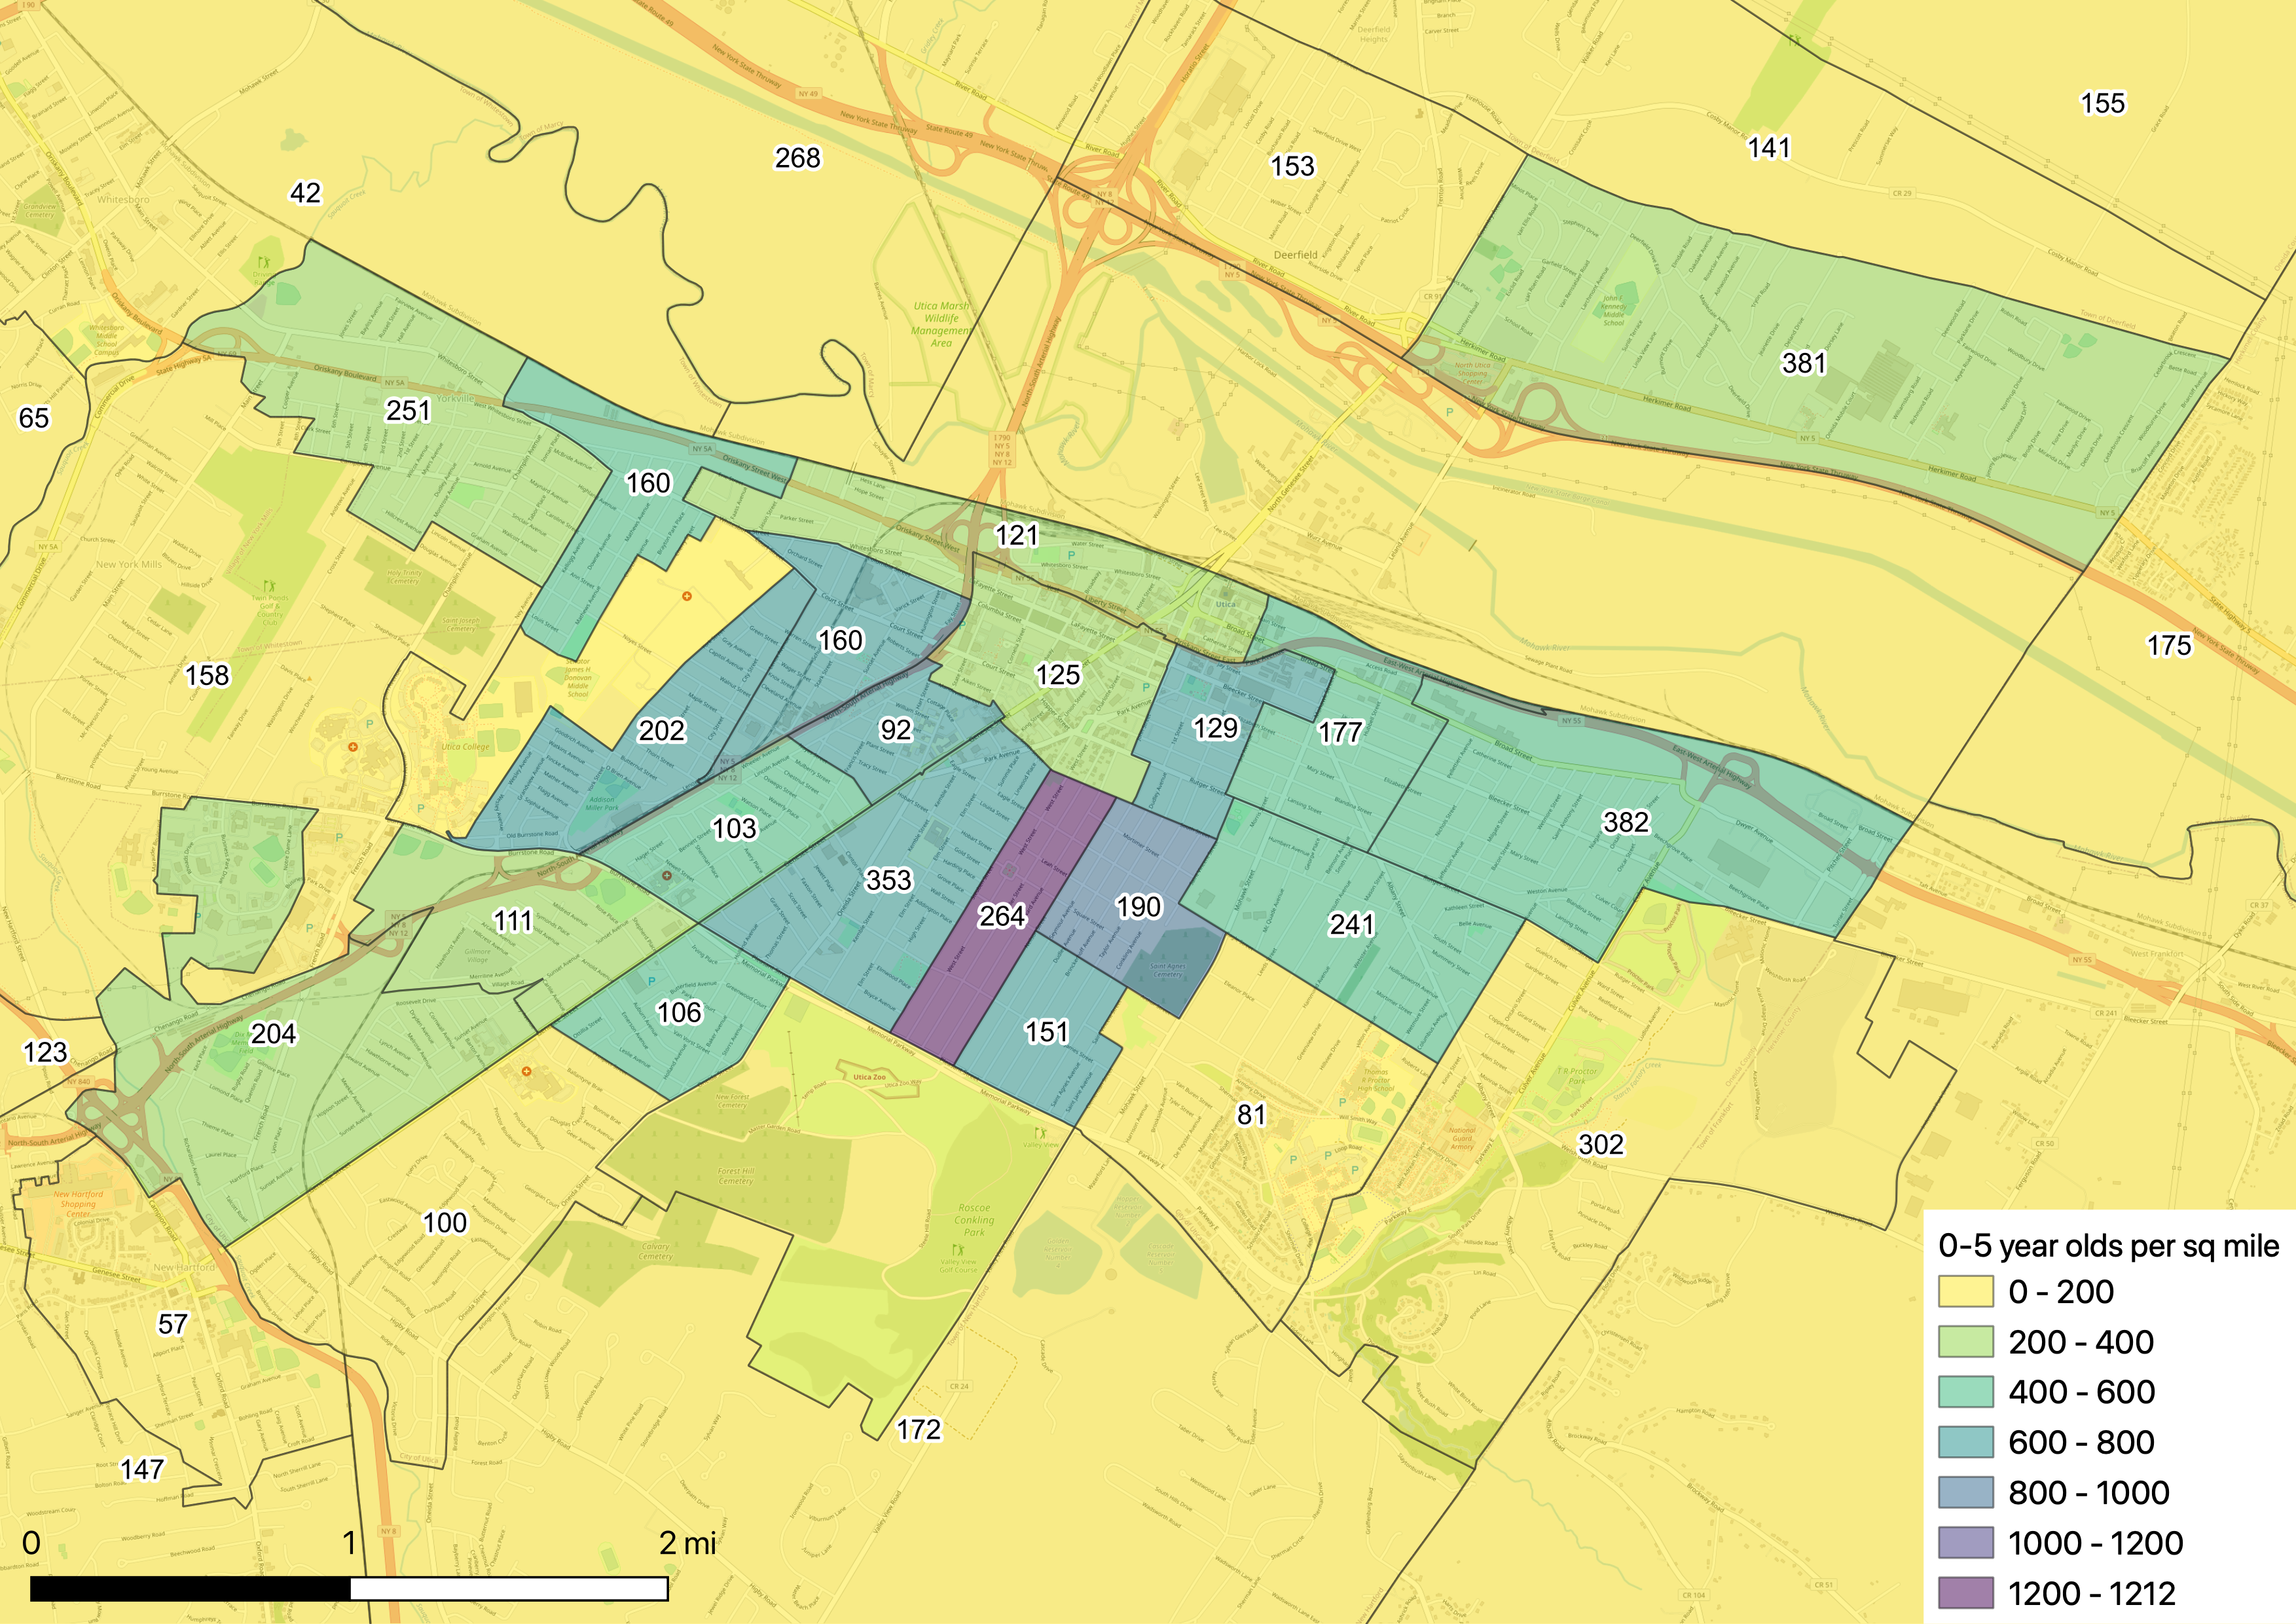
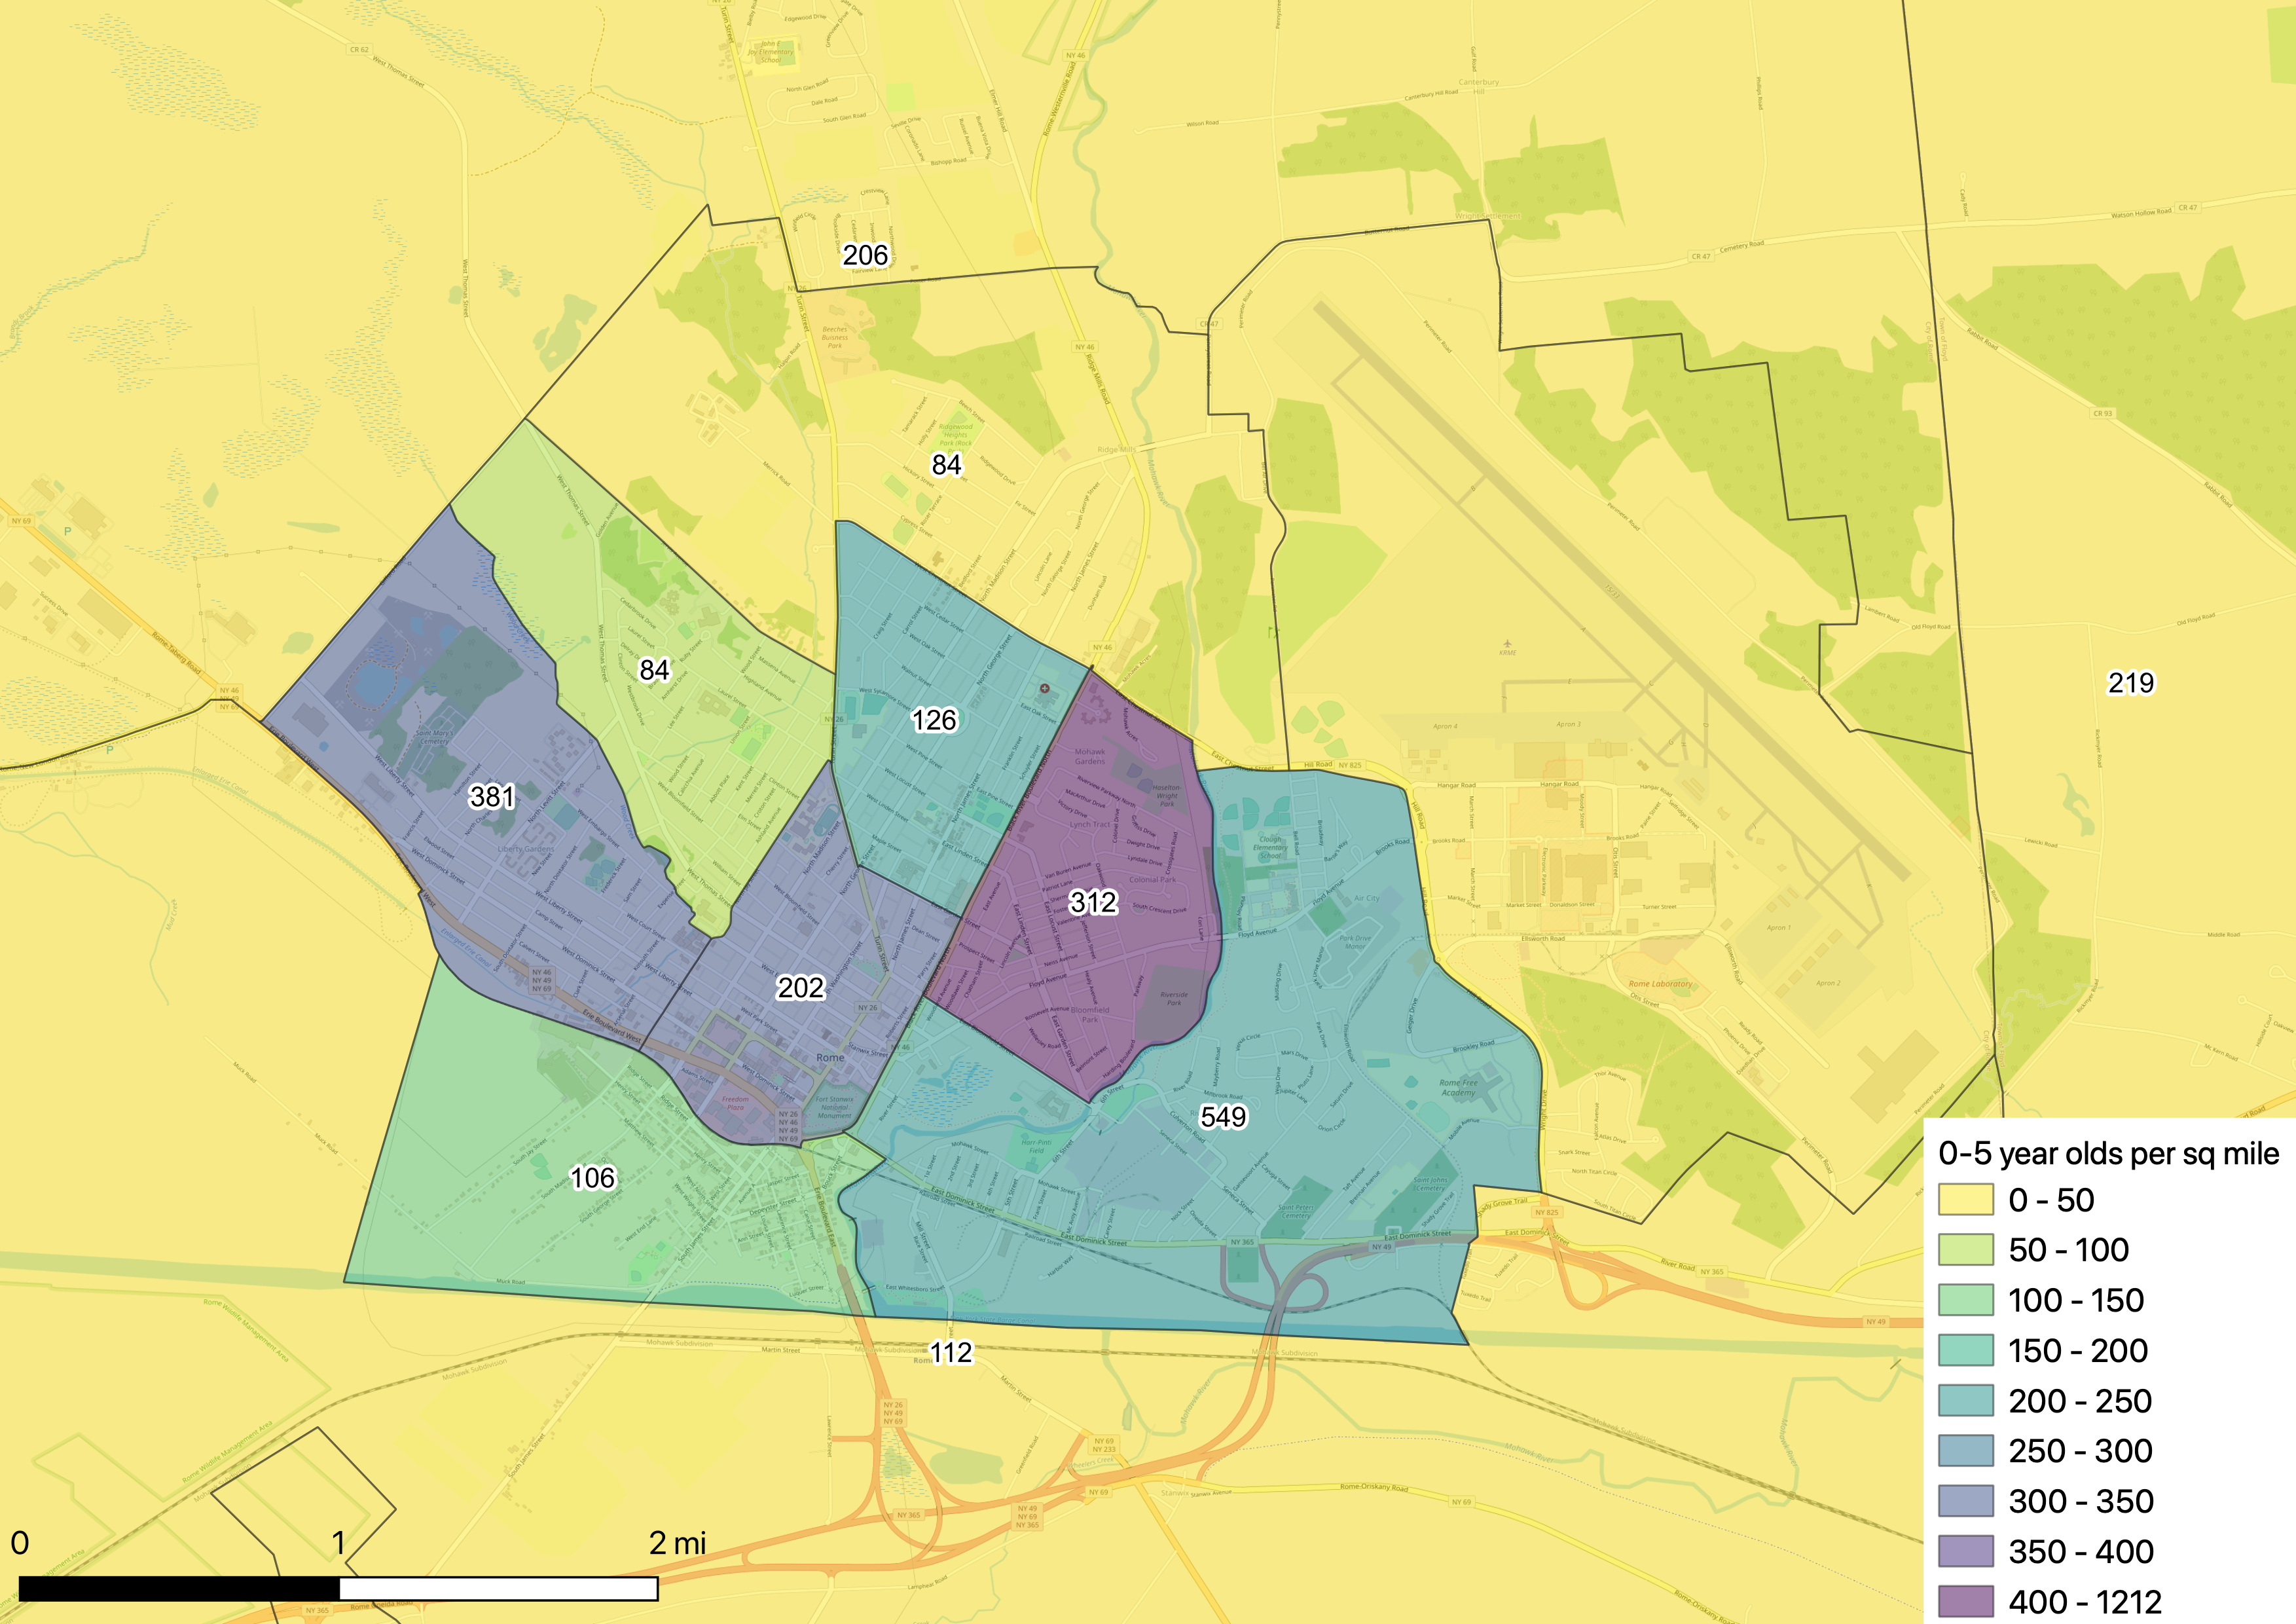
A local organization asked for a population density map of children aged 5 and below in Oneida County, for discussion about child care. See the images below. Coloring is population density of preschoolers, while the labels are the raw # of preschoolers. Note that Rome uses a different scale, since it’s much less dense. Here’s a PDF version as well.
Here I’ll explain how I created those maps, for the sake of anyone who might want to something similar and for my own notes. I used the open-source geographic information system QGIS. For a data source, I used the US Census’s TIGER/Line with Selected Demographic and Economic Data files. While it calls them “ArcGIS Geodatabases”, they work just fine in QGIS.
The US Census suppresses some data. That sounds like a political thing, but it’s actually there to protect people’s privacy and remove estimates that are too noisy. The census explains their methodology in a brief document. Oneida County is more sparsely populated than some other areas, so the lowest granularity that isn’t completely suppressed in Oneida County is the tract level for the 5-year ACS.
The geodatabase contains one shape file and then a series of tables. The first table is a metadata table, explaining the field names. The field names are encoded things like “B01001e3”, which the metadata table decodes as “SEX BY AGE: Male: Under 5 years: Total Population – (Estimate)”. You probably want to export the metadata table so you can have it open in another window while you work.
Each following table is a certain subset of data, for example X01_AGE_AND_SEX or X17_POVERTY. At this level, most of these are suppressed, but X01_AGE_AND_SEX isn’t, and that’s what I needed for the map.
The table must be joined to the shape file. You might think OBJECTID would be the join key, but you’d be wrong: you want GEOID on the shape file and GEOID_DATA on the table. Make sure to go to “Joined Fields” and select the fields you need, or else it’ll take years to render (at least on my aging laptop). You’ll also want to speed things up by filtering the shape file to the area you’re interested in. In my case that’s Oneida County and nearby Herkimer County, which have county FIPS codes 065 and 043.
B01001e3 is the field for males under 5 years old, and B01001e27 is the field for females under 5 years old. Adding them together gives the total number of children under 5 years old. (The census does not recognize intersex or nonbinary genders, apparently.) ALAND is the land area of the census tract, in square meters. Square meters are tiny, and I’d rather have square miles: There are 2.59 × 10⁶ square meters in a square mile.
All together, the formula for preschoolers per square mile is (B01001e3 + B01001e27) * 2.59E6 / ALAND, which goes in the symbology tab. I prefer viridis for a color scale, at 50% opacity so the underlying geography (from OpenStreetMap) is visible. I also added a label for the raw number of preschoolers in each tract, and a handful of other tweaks to make it pretty and informative.
Related Posts
- 2023-11-04: Spherical area coordinates, and a derived triangle center
- 2023-07-29: Homogeneous coordinates on the sphere with vectors
- 2022-08-30: Scaling the Schwarz triangle function
- 2022-08-27: Edges in the image of the Schwarz triangle function
- 2022-07-20: Area-preserving swirling of the disk
- 2022-03-03: Some dubious ways to calculate conformal polyhedral projections
- 2021-10-02: A variation on the Chamberlin trimetric map projection
- 2021-08-31: Snyder's equal-area projection
- 2021-06-12: Perspective projections with vectors
- 2021-05-29: A (sort of) Euclidean triangle on a non-Euclidean surface


